Open-source and cross-platform software to easily analyze biomechanical data.

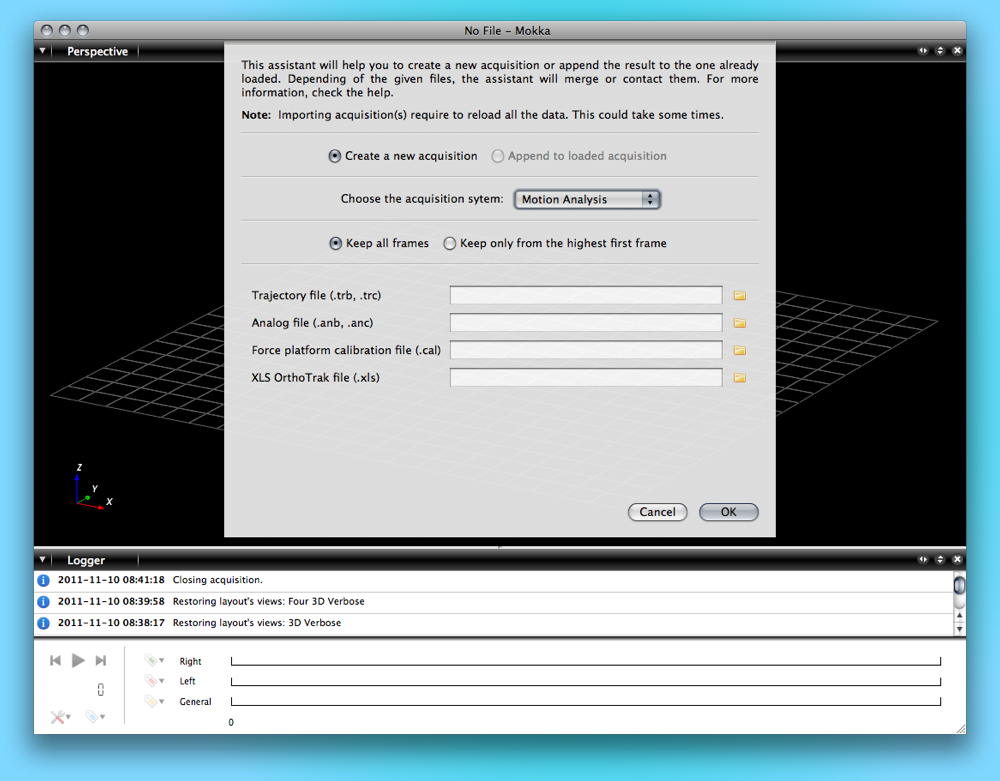
Reads, writes C3D files and many other formats!

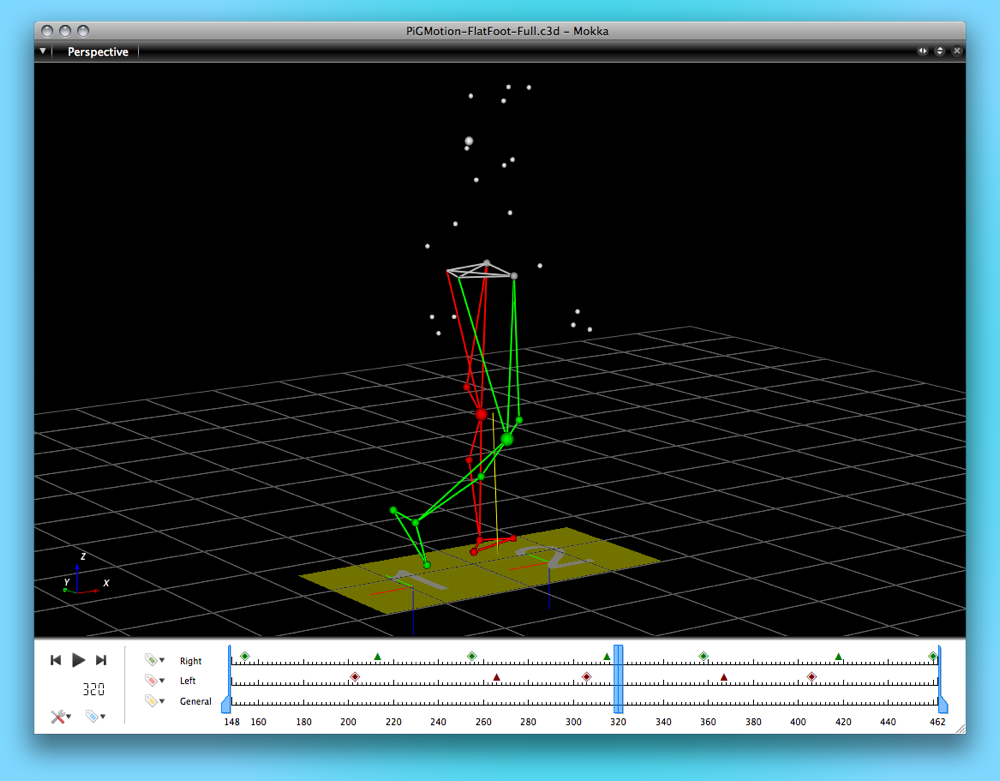
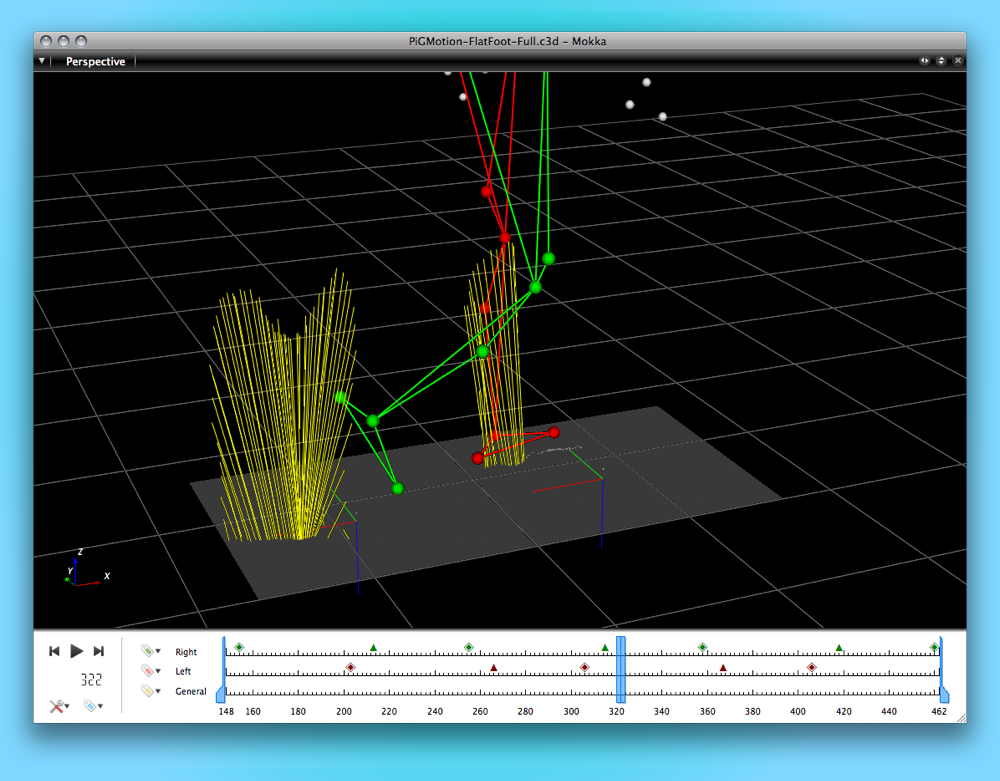
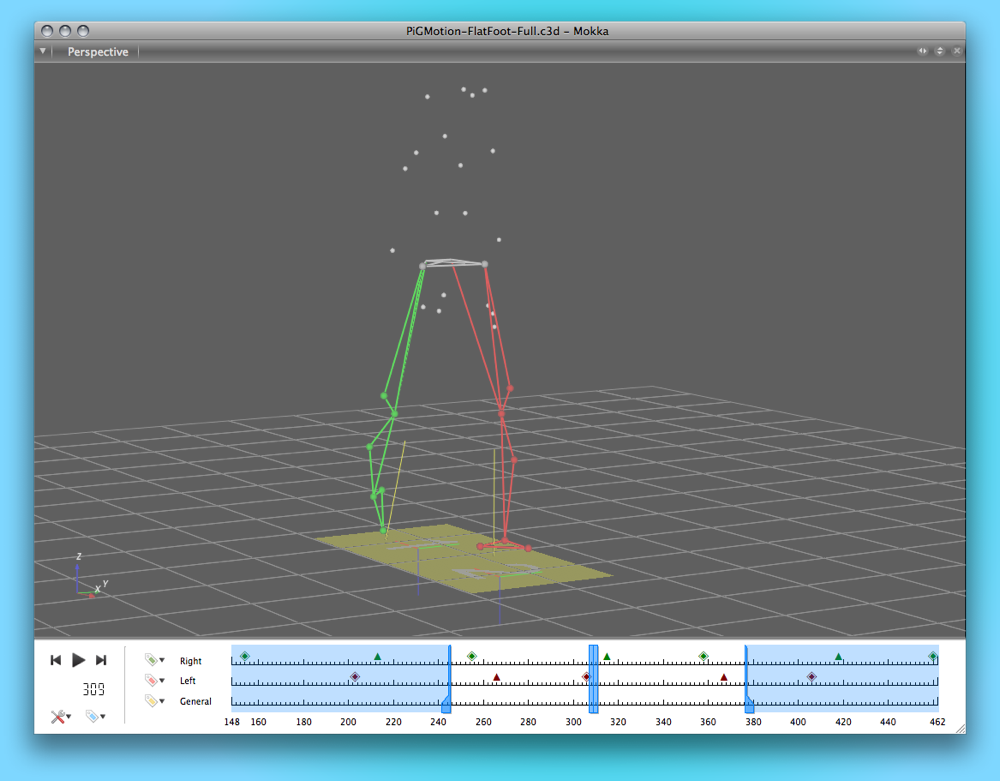
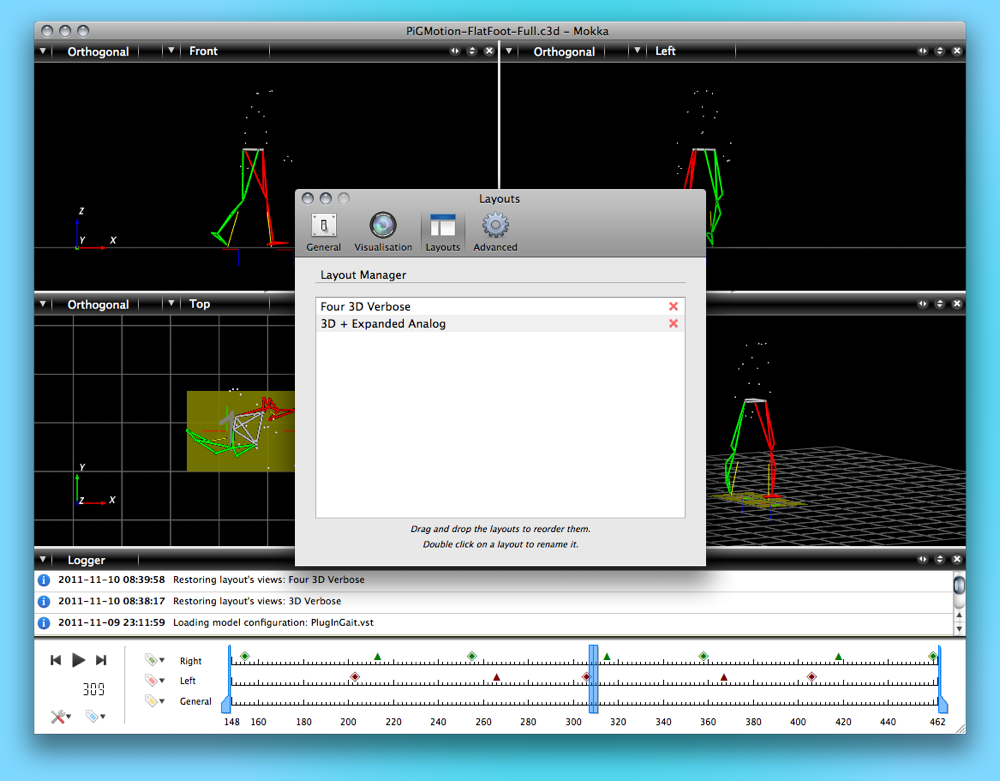
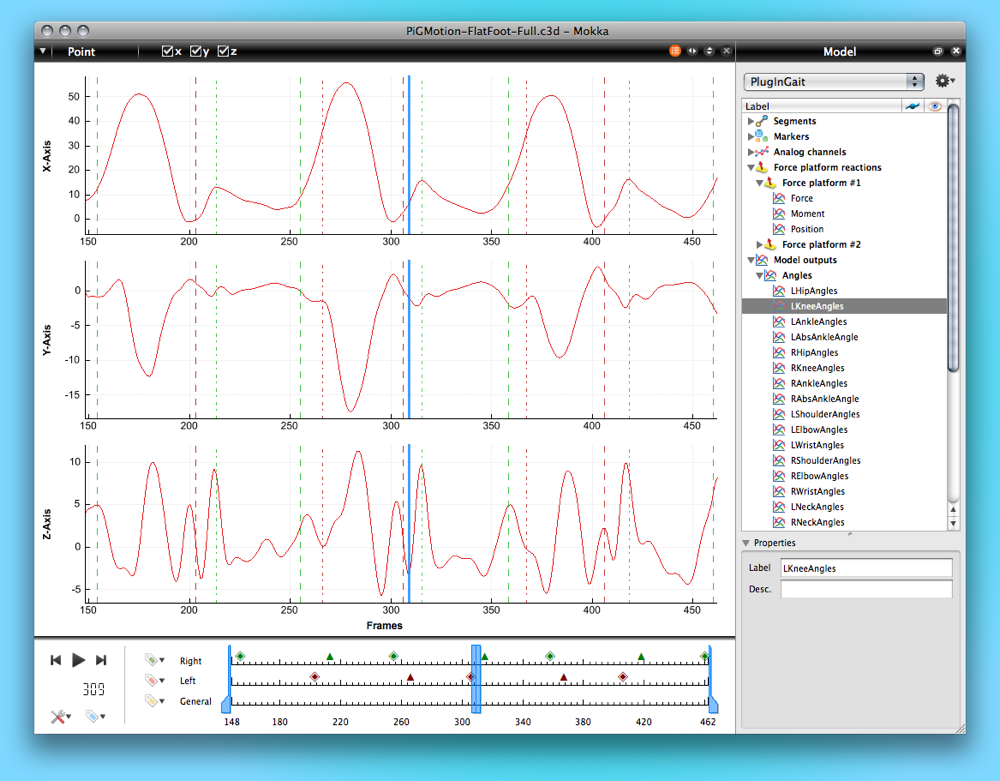
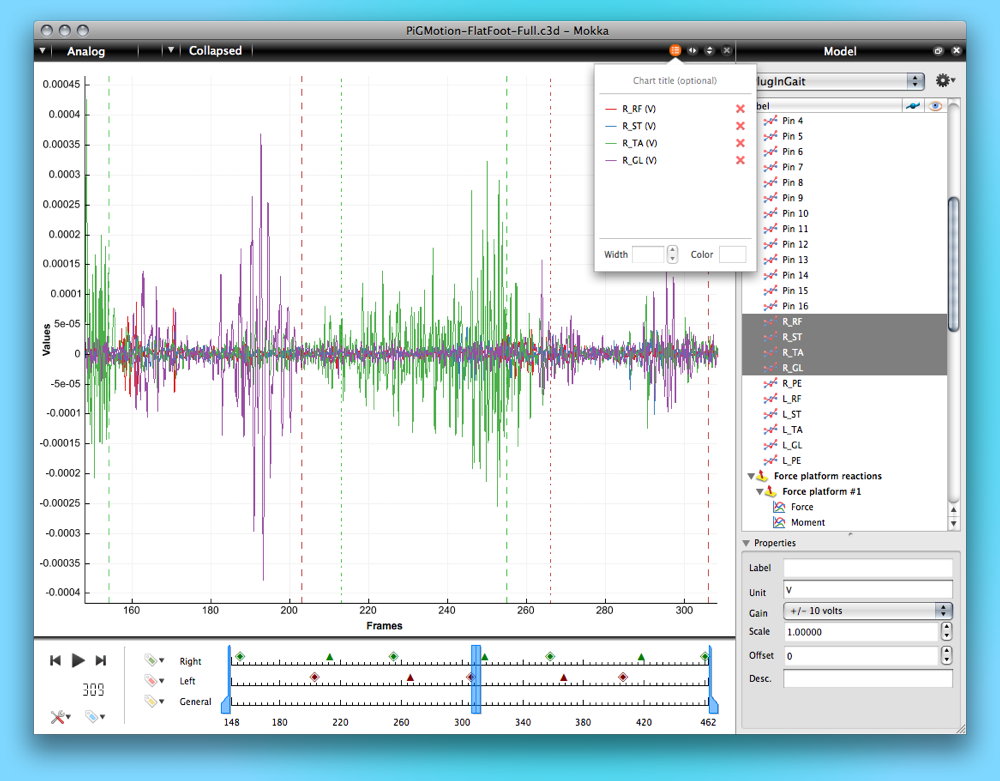
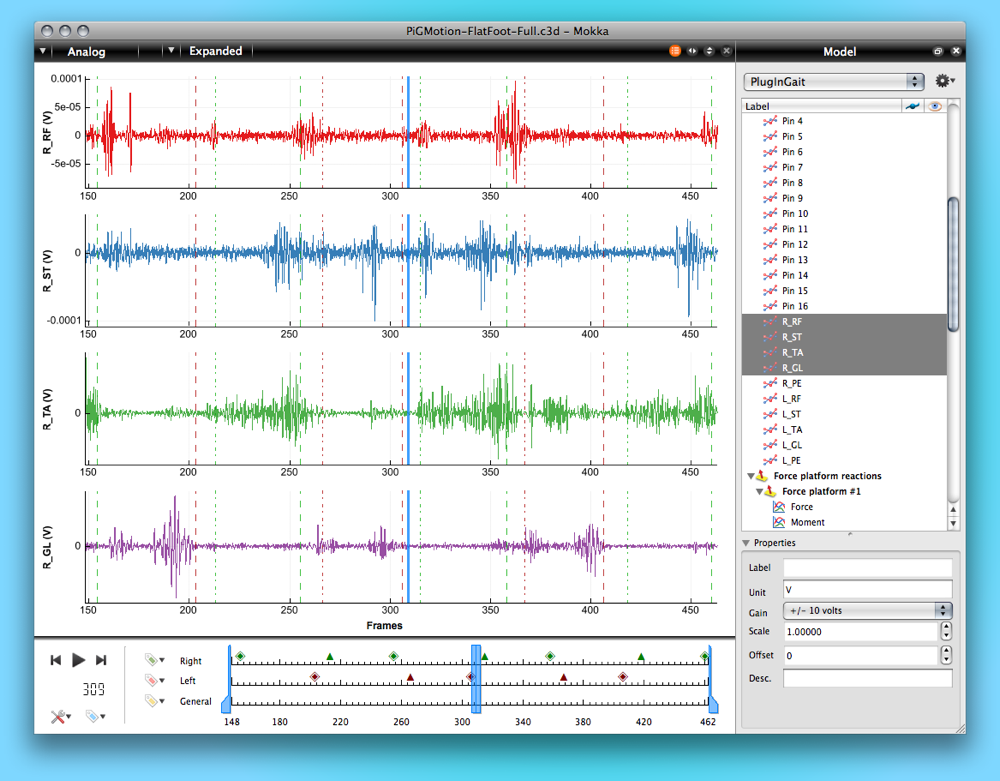
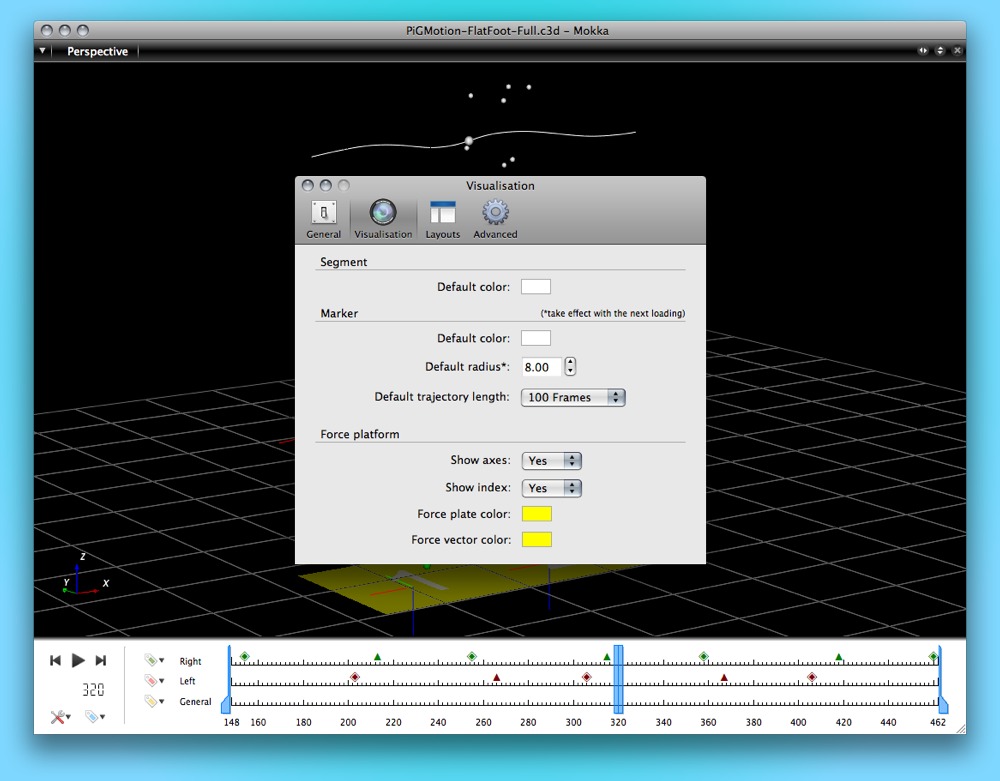
Visualize in 3D and 2D markers' trajectories, force platforms, segments, but also joint angles, forces, moments, as well as analog signals like EMGs.

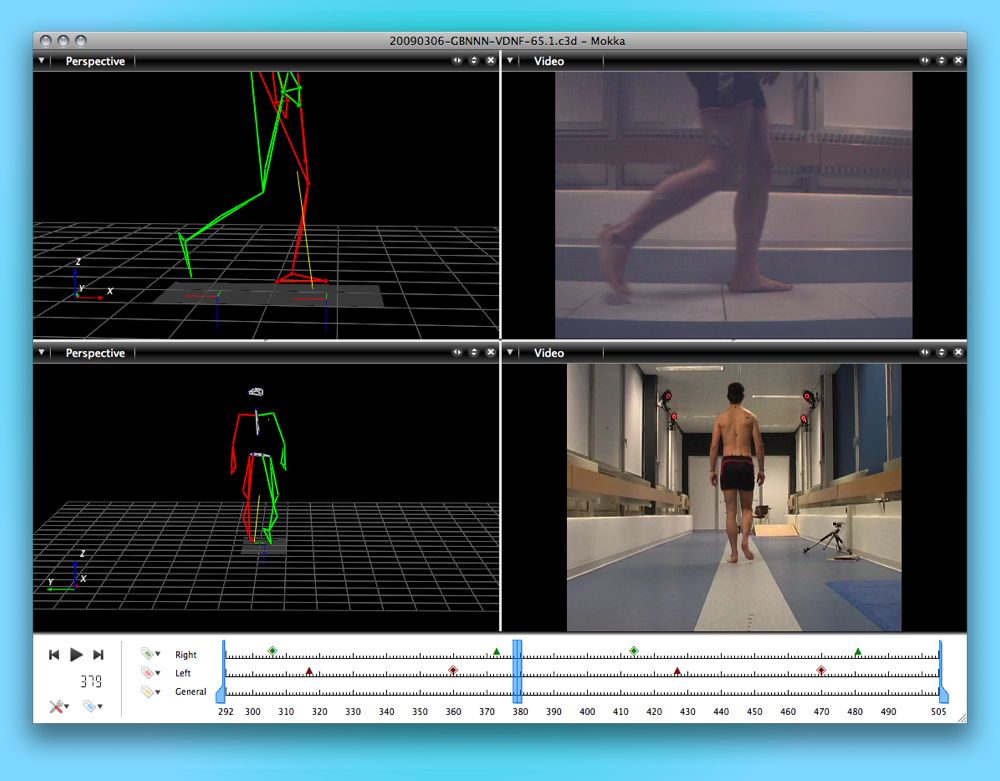
Finally an easy way to explore data between laboratories and hardwares.

Download Now

Features

Explore your biomechanical data in several ways

3D visualization

group1

Perspective view

The perspective view displays timeseries data in 3D such as markers, force platforms and segments.

And you can move freely around the data, select markers, display their trajectories or create segments.

group1

Orthogonal view

The orthogonal view gives you access to data only on predefined plane (top, bottom, right, left, front, back)

As with the perspective view, you can play with the data without any restrictions.

group1

Extra visualization

Several options in the 3D views are available to improve the user experience to better understand the kinematic and the kinetic of the acquisition.

Media

group1

Video

Open video files read natively on your computer. Detected automatically in C3D file format or using the import function.

Display synchronized and unsynchronized video. Adapt easily the delay between the loaded acquisition and each video.


Timeline & events

group1

Time bar

The time bar provides you all the controls for the playback. You can easily reduce the playback speed, select a region of interest and crop it.

The defined events are directly displayed in the time bar. You can easily interact with them to modify their informations.

Views configuration

group1

User layouts management

Save a layout of views and define it as default to be reloaded at the next launch.

Save other layouts and switch between them easily by using shortcuts.

2D chart

group1

Point chart

Plot the components of any 3D data (markers, angles, forces, etc.). Focus only on the component(s) of interest.

Mokka can easily stack the plotted data by a simple drag and drop.

group1

Collapsed analog chart

Plot analog data in a collapsed way to easily compare them. Zoom from different way to analyze the information of interest.

For each plot, you can easily modify its color or line width. Each chart can be clearly distinguishable by adding a title.

group1

Expanded analog chart

If you prefer to separate the analog signals, then by a single click spread them. Want to go back to the stacked view? Let's click again!

The events but also the current frame played are visible as vertical lines.

File I/O

group1

Import assistant / Export

Need to collaborate with another team, but your hardware is not the same? Simply import your files into Mokka and focus on your main task: the analysis of valuable data.

Easily merge files together to create a complete acquisition with all of the data of interest.

Data accessibility

group1

Acquisition explorer

Explore easily the content of the loaded acquisition. Modify the properties of the markers, create new segments, remove data, and much more by simple clicks.

The model panel can load Mokka model configuration file (MVC) as well as Vicon model configuration files (VSK/VST).

Settings

group1

Preferences / Options

Set the default properties for the visualization of the 3D objects. All of the properties are updated in every 3D views.

The general preferences provide also an option for the default orientation of the ground.